StateArrayDataset
- class StateArrayDataset(self, paths: pandas.DataFrame, likelihood: Likelihood, params: StateArrayParameters, path_col: str, condition_col: str = None, **kwargs)
Implements routines to run state arrays at the dataset level. Parallelizes inference across multiple files and provides visualization methods to compare different experimental conditions.
The structure of the SPT dataset is specified with the paths argument. This is a pandas.DataFrame that encodes the path and experimental condition for all files in the dataset. Only two columns in this DataFrame are recognized:
path_col (required): encodes the path to each SPT trajectory file
condition_col (optional): encodes the experimental condition to which that file belongs
If the DataFrame contains other columns, they are ignored.
An example is provided by the file experiment_conditions.csv under the
examplesfolder in the saSPT repo. The path_col is filepath and condition_col is condition:$ cat experiment_conditions.csv | head filepath,condition u2os_ht_nls_7.48ms/region_0_7ms_trajs.csv,HaloTag-NLS u2os_ht_nls_7.48ms/region_10_7ms_trajs.csv,HaloTag-NLS ...Running from the saspt/examples directory, we can construct a StateArrayDataset as follows:
import pandas as pd
from saspt import StateArrayDataset, RBME

# Load the paths DataFrame
paths = pd.read_csv("experiment_conditions.csv")

# Settings for state array inference
settings = dict(
    likelihood_type = RBME,   # type of likelihood function to use
    pixel_size_um = 0.16,     # camera pixel size in microns
    frame_interval = 0.00748, # frame interval in seconds
    focal_depth = 0.7,        # objective focal depth in microns
    path_col = 'filepath',    # column in *paths* encoding file path
    condition_col='condition',# column in *paths* encoding
                              # experimental condition
    num_workers = 4,          # parallel processes to use
    progress_bar = True,      # show progress
)

# Make a StateArrayDataset with these settings
with StateArrayDataset.from_kwargs(paths, **settings) as SAD:
    print(SAD)
The output of this script is:
StateArrayDataset:
    likelihood_type    : rbme
    shape              : (101, 36)
    n_files            : 22
    path_col           : filepath
    condition_col      : condition
    conditions         : ['HaloTag-NLS' 'RARA-HaloTag']
StateArrayDataset implements several methods to get information about a dataset. Continuing with the example above,
# Make a StateArrayDataset with these settings
with StateArrayDataset.from_kwargs(paths, **settings) as SAD:

    # Save some statistics on each SPT file, including the number
    # of trajectories, trajectory length, etc.
    SAD.raw_track_statistics.to_csv("raw_track_statistics.csv", index=False)

    # Save the posterior state occupations to a file
    SAD.marginal_posterior_occs_dataframe.to_csv(
        "marginal_posterior_distribution.csv", index=False)

    # Make some plots comparing the naive state occupations across all
    # files in this dataset
    SAD.naive_heat_map("naive_heat_map.png")
    SAD.naive_line_plot("naive_line_plot.png")

    # Make some plots comparing the posterior state occupations across all
    # files in this dataset
    SAD.posterior_heat_map("posterior_heat_map.png")
    SAD.posterior_line_plot("posterior_line_plot.png")

    # Do some kind of specific calculation; for example, calculate the
    # fraction of particles with diffusion coefficients less than 1.0
    # in each file
    print(SAD.marginal_posterior_occs[:,SAD.diff_coefs<1.0].sum(axis=1))
Warning
An important parameter when constructing the StateArrayDataset is num_workers, the number of parallel processes. This should not be set higher than the number of CPUs you have access to. Otherwise you’ll suffer performance drops.
- Parameters
paths (pandas.DataFrame) –
likelihood_type (str) –
path_col (str) –
condition_col (str) –
pixel_size_um (float) –
frame_interval (float) –
focal_depth (float) –
num_workers (int) –
progress_bar (bool) –
- classmethod from_kwargs(cls, paths: pandas.DataFrame, likelihood_type: str, path_col: str, condition_col: str = None, **kwargs)
- Parameters
paths (pandas.DataFrame) –
likelihood_type (str) –
path_col (str) –
condition_col (str) –
pixel_size_um (float) –
frame_interval (float) –
focal_depth (float) –
num_workers (int) –
progress_bar (bool) –
- Returns
new instance of StateArrayDataset
- likelihood: Likelihood
The likelihood function used by all of the state arrays in this StateArrayDataset.
- property n_files: int
Total number of files in this StateArrayDataset.
- property shape: Tuple[int]
- property likelihood_type: str
Name of the likelihood function; equivalent to StateArrayDataset.likelihood.name
- property n_diff_coefs: int
Number of distinct diffusion coefficients in the parameter grid corresponding to this Likelihood function.
If self.likelihood does not use diffusion coefficient as a parameter, is 0.
- property jumps_per_file: numpy.ndarray
Shape (n_files,), the number of observed jumps in each file (after preprocessing).
- property raw_track_statistics: pandas.DataFrame
Raw trajectory statistics for this dataset. Each row of the DataFrame corresponds to one file, and each column to an attribute of that file.
Continuing with the previous example,
>>> with StateArray(paths, **settings) as SAD:
...     track_stats = SAD.raw_track_statistics

>>> print(track_stats.columns)
Index(['n_tracks', 'n_jumps', 'n_detections', 'mean_track_length',
   'max_track_length', 'fraction_singlets', 'fraction_unassigned',
   'mean_jumps_per_track', 'mean_detections_per_frame',
   'max_detections_per_frame', 'fraction_of_frames_with_detections',
   'filepath', 'condition'],
  dtype='object')

>>> print(track_stats[['mean_track_length', 'fraction_singlets', 'condition']])
    mean_track_length  fraction_singlets     condition
0            1.636783           0.839129   HaloTag-NLS
1            2.075513           0.666734   HaloTag-NLS
2            1.784457           0.746812   HaloTag-NLS
3            1.986613           0.675709   HaloTag-NLS
4            2.004172           0.698274   HaloTag-NLS
..                ...                ...           ...
17           3.881071           0.571429  RARA-HaloTag
18           3.826364           0.557824  RARA-HaloTag
19           3.423219           0.591547  RARA-HaloTag
20           3.682189           0.536682  RARA-HaloTag
21           3.520319           0.595750  RARA-HaloTag

[22 rows x 3 columns]
Notice that the trajectories from the HaloTag-NLS conditions are shorter and more likely to be singlets than the trajectories in the RARA-HaloTag condition.
- property processed_track_statistics: pandas.DataFrame
Trajectory statistics for this dataset after preprocessing. Each row of the DataFrame corresponds to one file, and each column to an attribute of that file.
This is identical in form to
raw_track_statistics.
- property marginal_naive_occs: numpy.ndarray
Shape (n_files, n_diff_coefs), naive state occupations for each file marginalized on diffusion coefficient.
- property marginal_posterior_occs: numpy.ndarray
Shape (n_files, n_diff_coefs), posterior state occupations for each file marginalized on diffusion coefficient.
- property marginal_posterior_occs_dataframe: pandas.DataFrame
pandas.DataFrame representation of
marginal_posterior_occs. Each row corresponds to a single state in a single file, so that the total number of rows is equal to n_files * n_diff_coefs.Continuing the example from above,
>>> SAD = StateArrayDataset.from_kwargs(paths, **settings)
>>> diff_coefs = SAD.diff_coefs
>>> df = SAD.marginal_posterior_occs_dataframe

# Calculate the estimated fraction of trajectories with diffusion
# coefficients below 0.1 µm2/sec for all files in this dataset
>>> print(df.loc[df['diff_coef'] < 0.1].groupby('filepath')['posterior_occupation'].sum())
filepath
u2os_ht_nls_7.48ms/region_0_7ms_trajs.csv     0.173923
u2os_ht_nls_7.48ms/region_10_7ms_trajs.csv    0.067899
u2os_ht_nls_7.48ms/region_1_7ms_trajs.csv     0.165322
u2os_ht_nls_7.48ms/region_2_7ms_trajs.csv     0.020263
u2os_ht_nls_7.48ms/region_3_7ms_trajs.csv     0.101379
                                                ...
u2os_rara_ht_7.48ms/region_5_7ms_trajs.csv    0.364910
u2os_rara_ht_7.48ms/region_6_7ms_trajs.csv    0.430909
u2os_rara_ht_7.48ms/region_7_7ms_trajs.csv    0.426619
u2os_rara_ht_7.48ms/region_8_7ms_trajs.csv    0.350441
u2os_rara_ht_7.48ms/region_9_7ms_trajs.csv    0.553296
Name: posterior_occupation, Length: 22, dtype: float64
- clear(self)
Clear all cached attributes.
- apply_by(self, col: str, func: Callable, is_variadic: bool = False, **kwargs)
Apply a function in parallel to groups of files identified by a common value in self.paths[col]. Essentially equivalent to a parallel version of self.paths.groupby(col)[self.path_col].apply(func).
func should have the signature func(paths: List[str], **kwargs) if is_variadic == False, or func(*paths: str, **kwargs) if is_variadic == True.
- Parameters
col (str) – a column in self.paths to group files by
func (Callable) – function to apply to each file group
is_variadic (bool) – func is a variadic function
kwargs – additional keyword arguments to func
- Returns
result (list), group_names (List[str])
- infer_posterior_by_condition(self, col: str, normalize: bool = False)
Group files by common values of self.paths[col] and infer the marginal posterior occupations for each file group.
- Parameters
col (str) – column in self.paths to group by
normalize (bool) – normalize the posterior occupations over all states for each file
- Returns
posterior_occs (numpy.ndarray), group_names (List[str]). posterior_occs is a 2D array of shape (n_groups, n_diff_coefs) with the marginal posterior occupations for each file group, and group_names is the names of each group.
- calc_marginal_naive_occs(self, *track_paths: str) numpy.ndarray:
Calculate the naive state occupations (marginalized on diffusion coefficient) for one or more files. If multiple files are passed, runs on the concatenation of the detections across files.
If you want to infer the marginal naive occupations for all of the files in this StateArrayDataset, use StateArrayDataset.marginal_naive_occs instead.
- Parameters
track_paths (str) – full paths to one or more files with detections
- Returns
naive_occs (numpy.ndarray), 1D array of shape (n_diff_coefs,), the marginal naive state occupations
- calc_marginal_posterior_occs(self, *track_paths: str) numpy.ndarray:
Calculate the posterior state occupations (marginalized on diffusion coefficient) for one or more files. If multiple files are passed, runs on the concatenation of the detections across files.
If you want to infer the marginal naive occupations for all of the files in this StateArrayDataset, use StateArrayDataset.marginal_naive_occs instead.
- Parameters
track_paths (str) – full paths to one or more files with detections
- Returns
naive_occs (numpy.ndarray), 1D array of shape (n_diff_coefs,), the marginal posterior state occupations
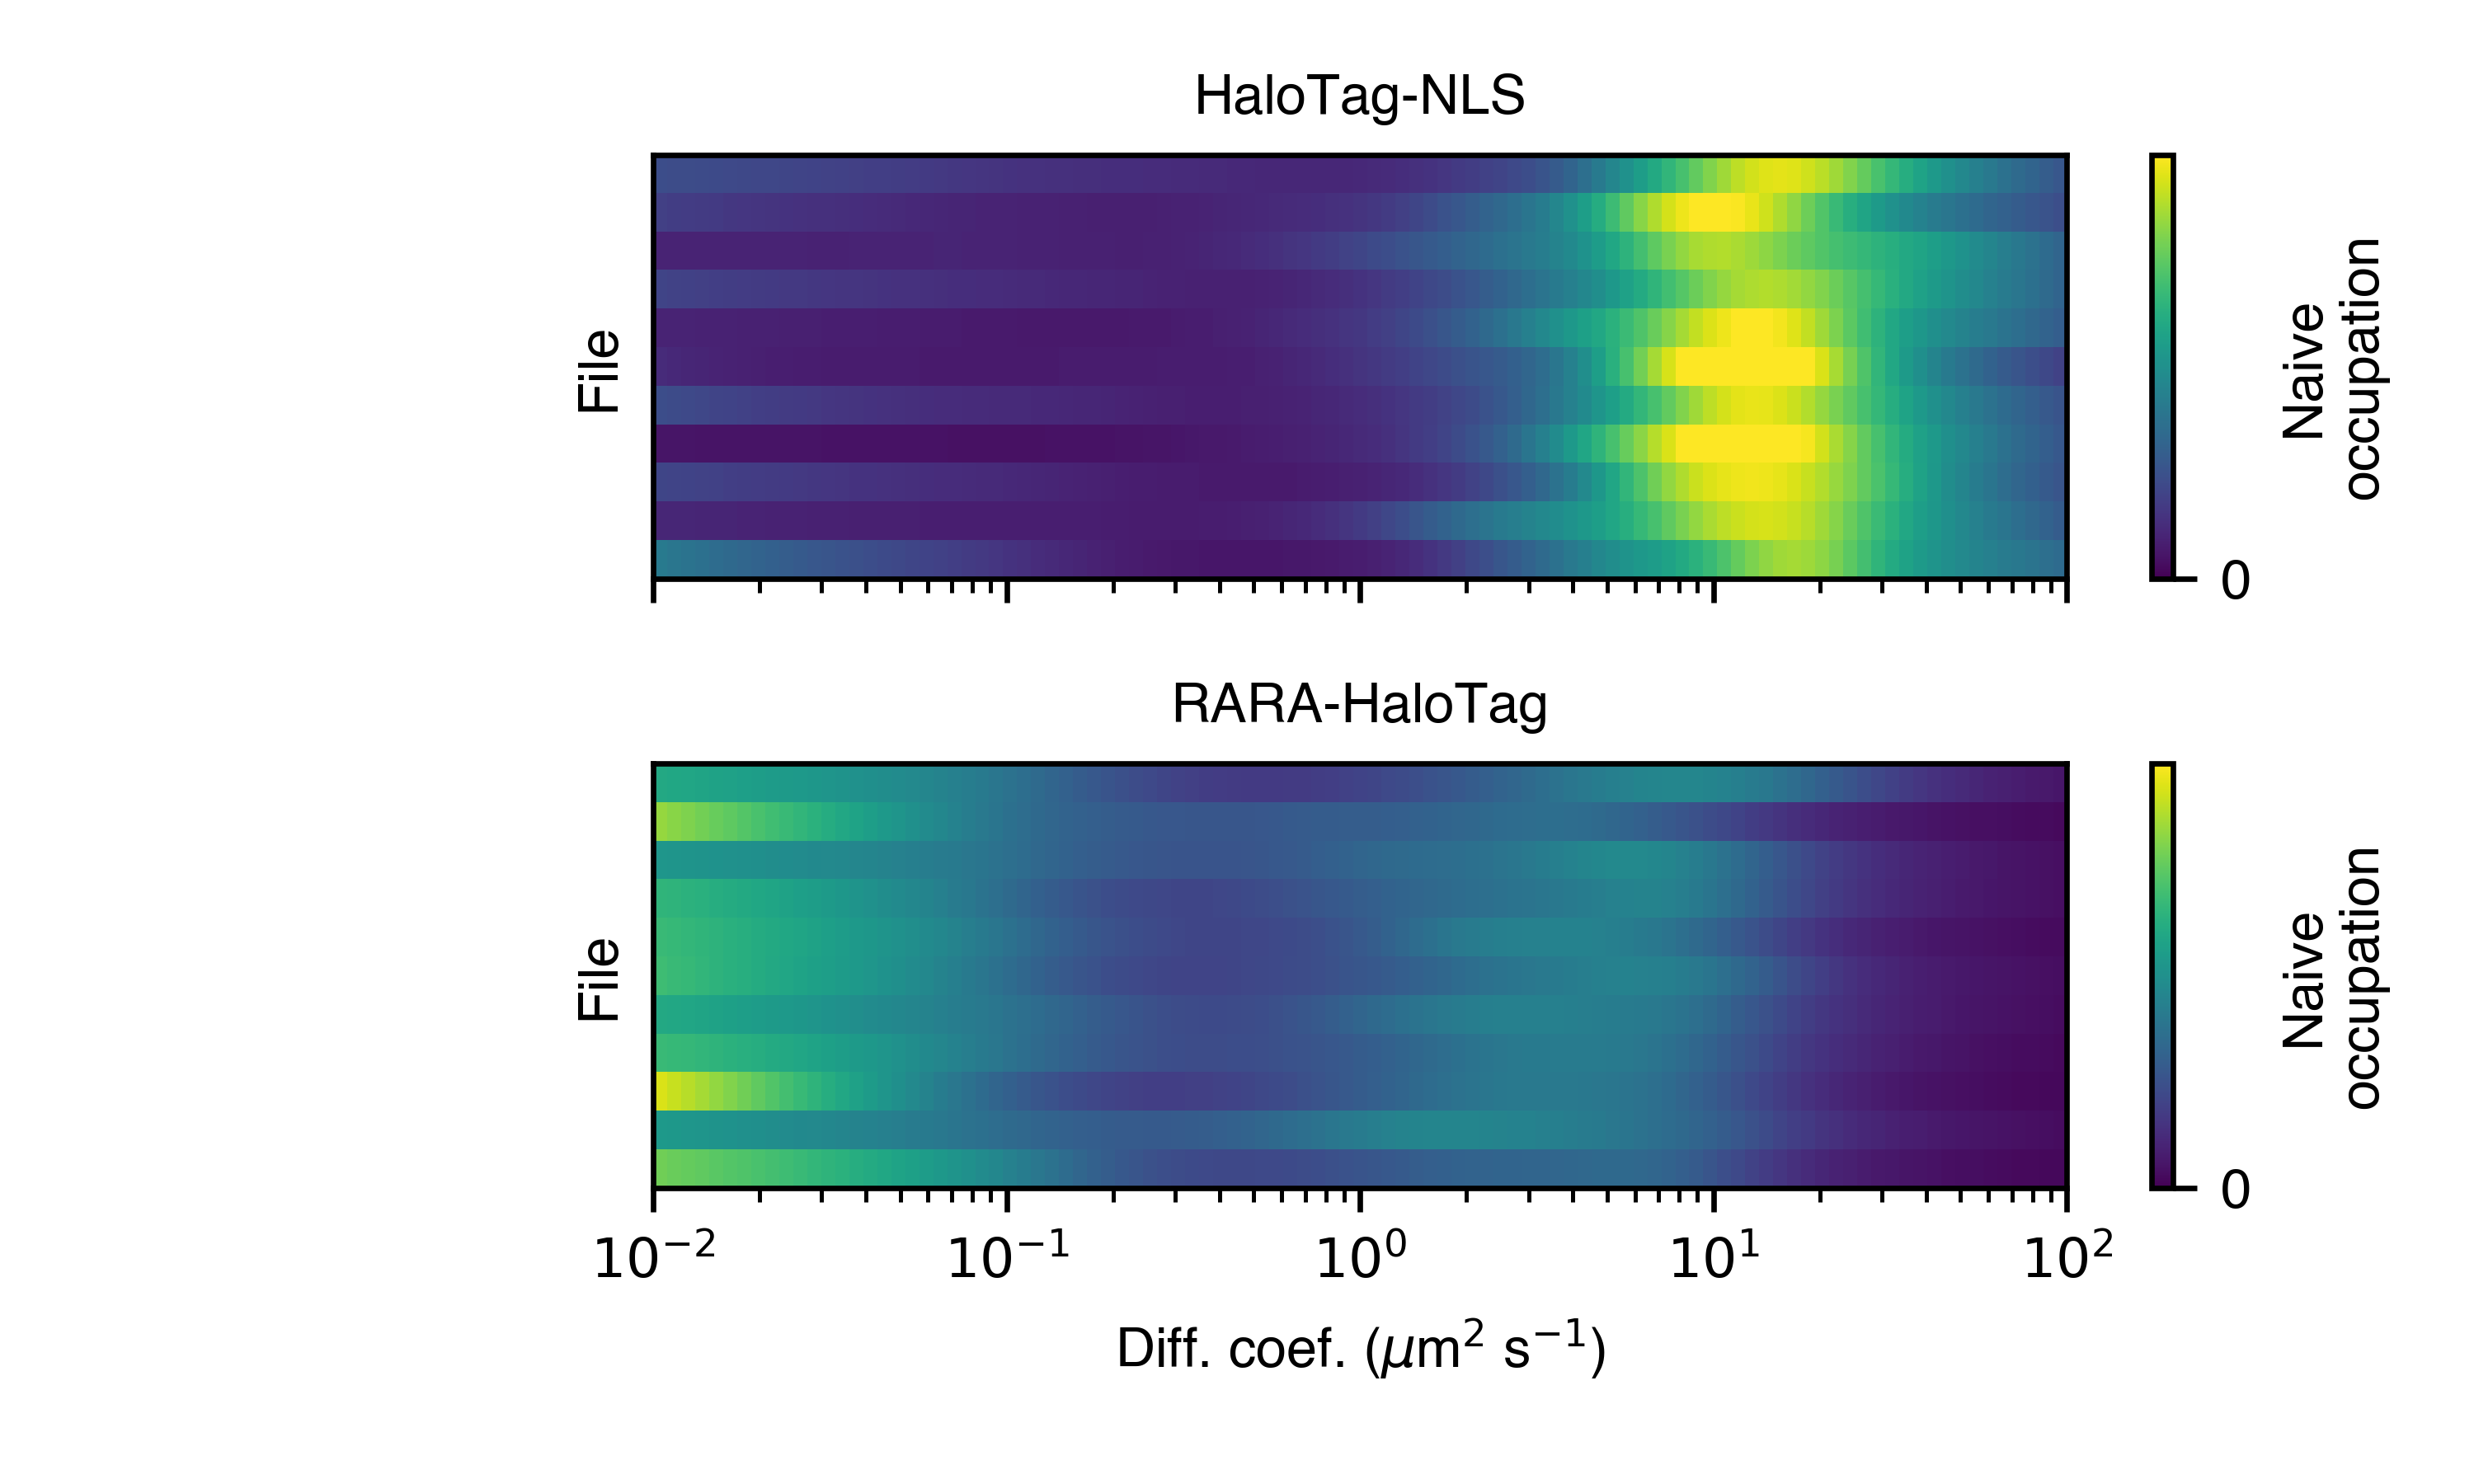
- naive_heat_map(self, out_png: str, normalize: bool = True, order_by_size: bool = True, **kwargs)
Naive state occupations, marginalized on diffusion coefficient, shown as a heat map. Groups by condition.
With normalize = True:
- Parameters
out_png (str) – save path for this plot
normalize (bool) – normalize the state occupations for each file in the dataset. If False, the intensity for each file is proportional to the number of jumps observed in that SPT experiment.
order_by_size (bool) – within each condition group, order the files by decreasing number of observed jumps.
kwargs – additional kwargs to the plotting function
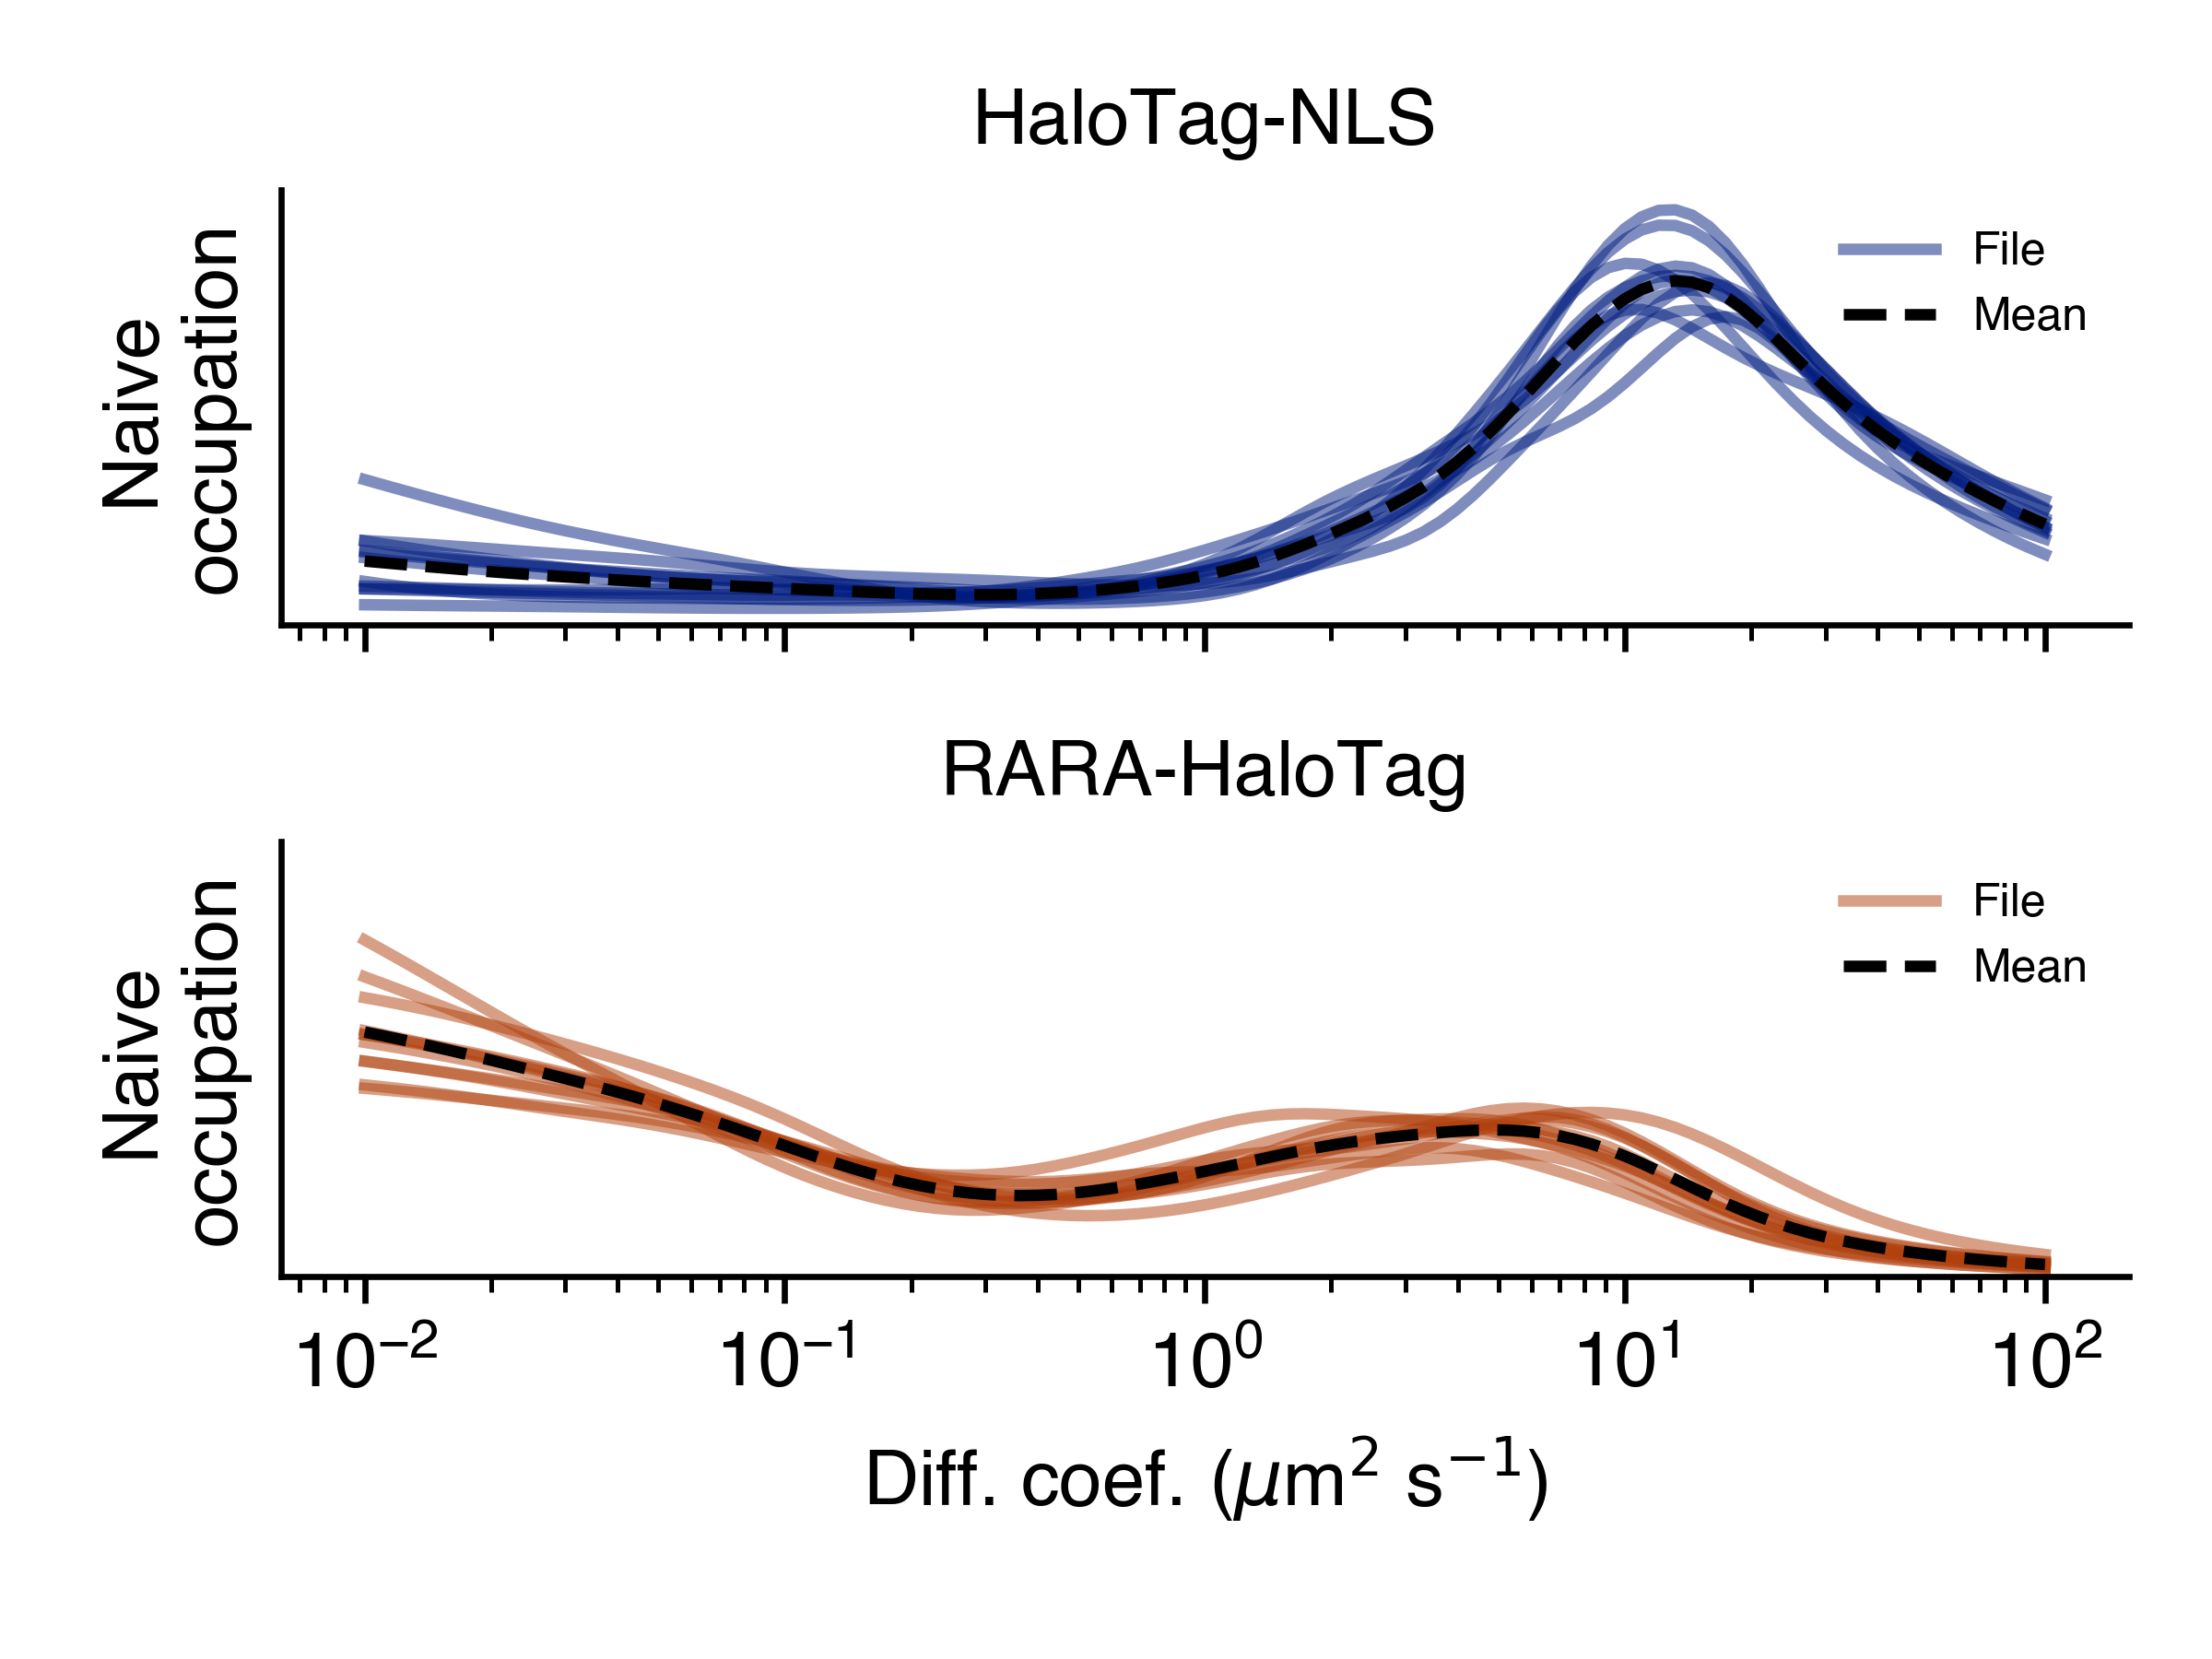
- naive_line_plot(self, out_png: str, **kwargs)
Naive state occupations, marginalized on diffusion coefficient, shown as a line plot. Groups by condition.
- Parameters
out_png (str) – save path for this plot
kwargs – additional kwargs to the plotting function
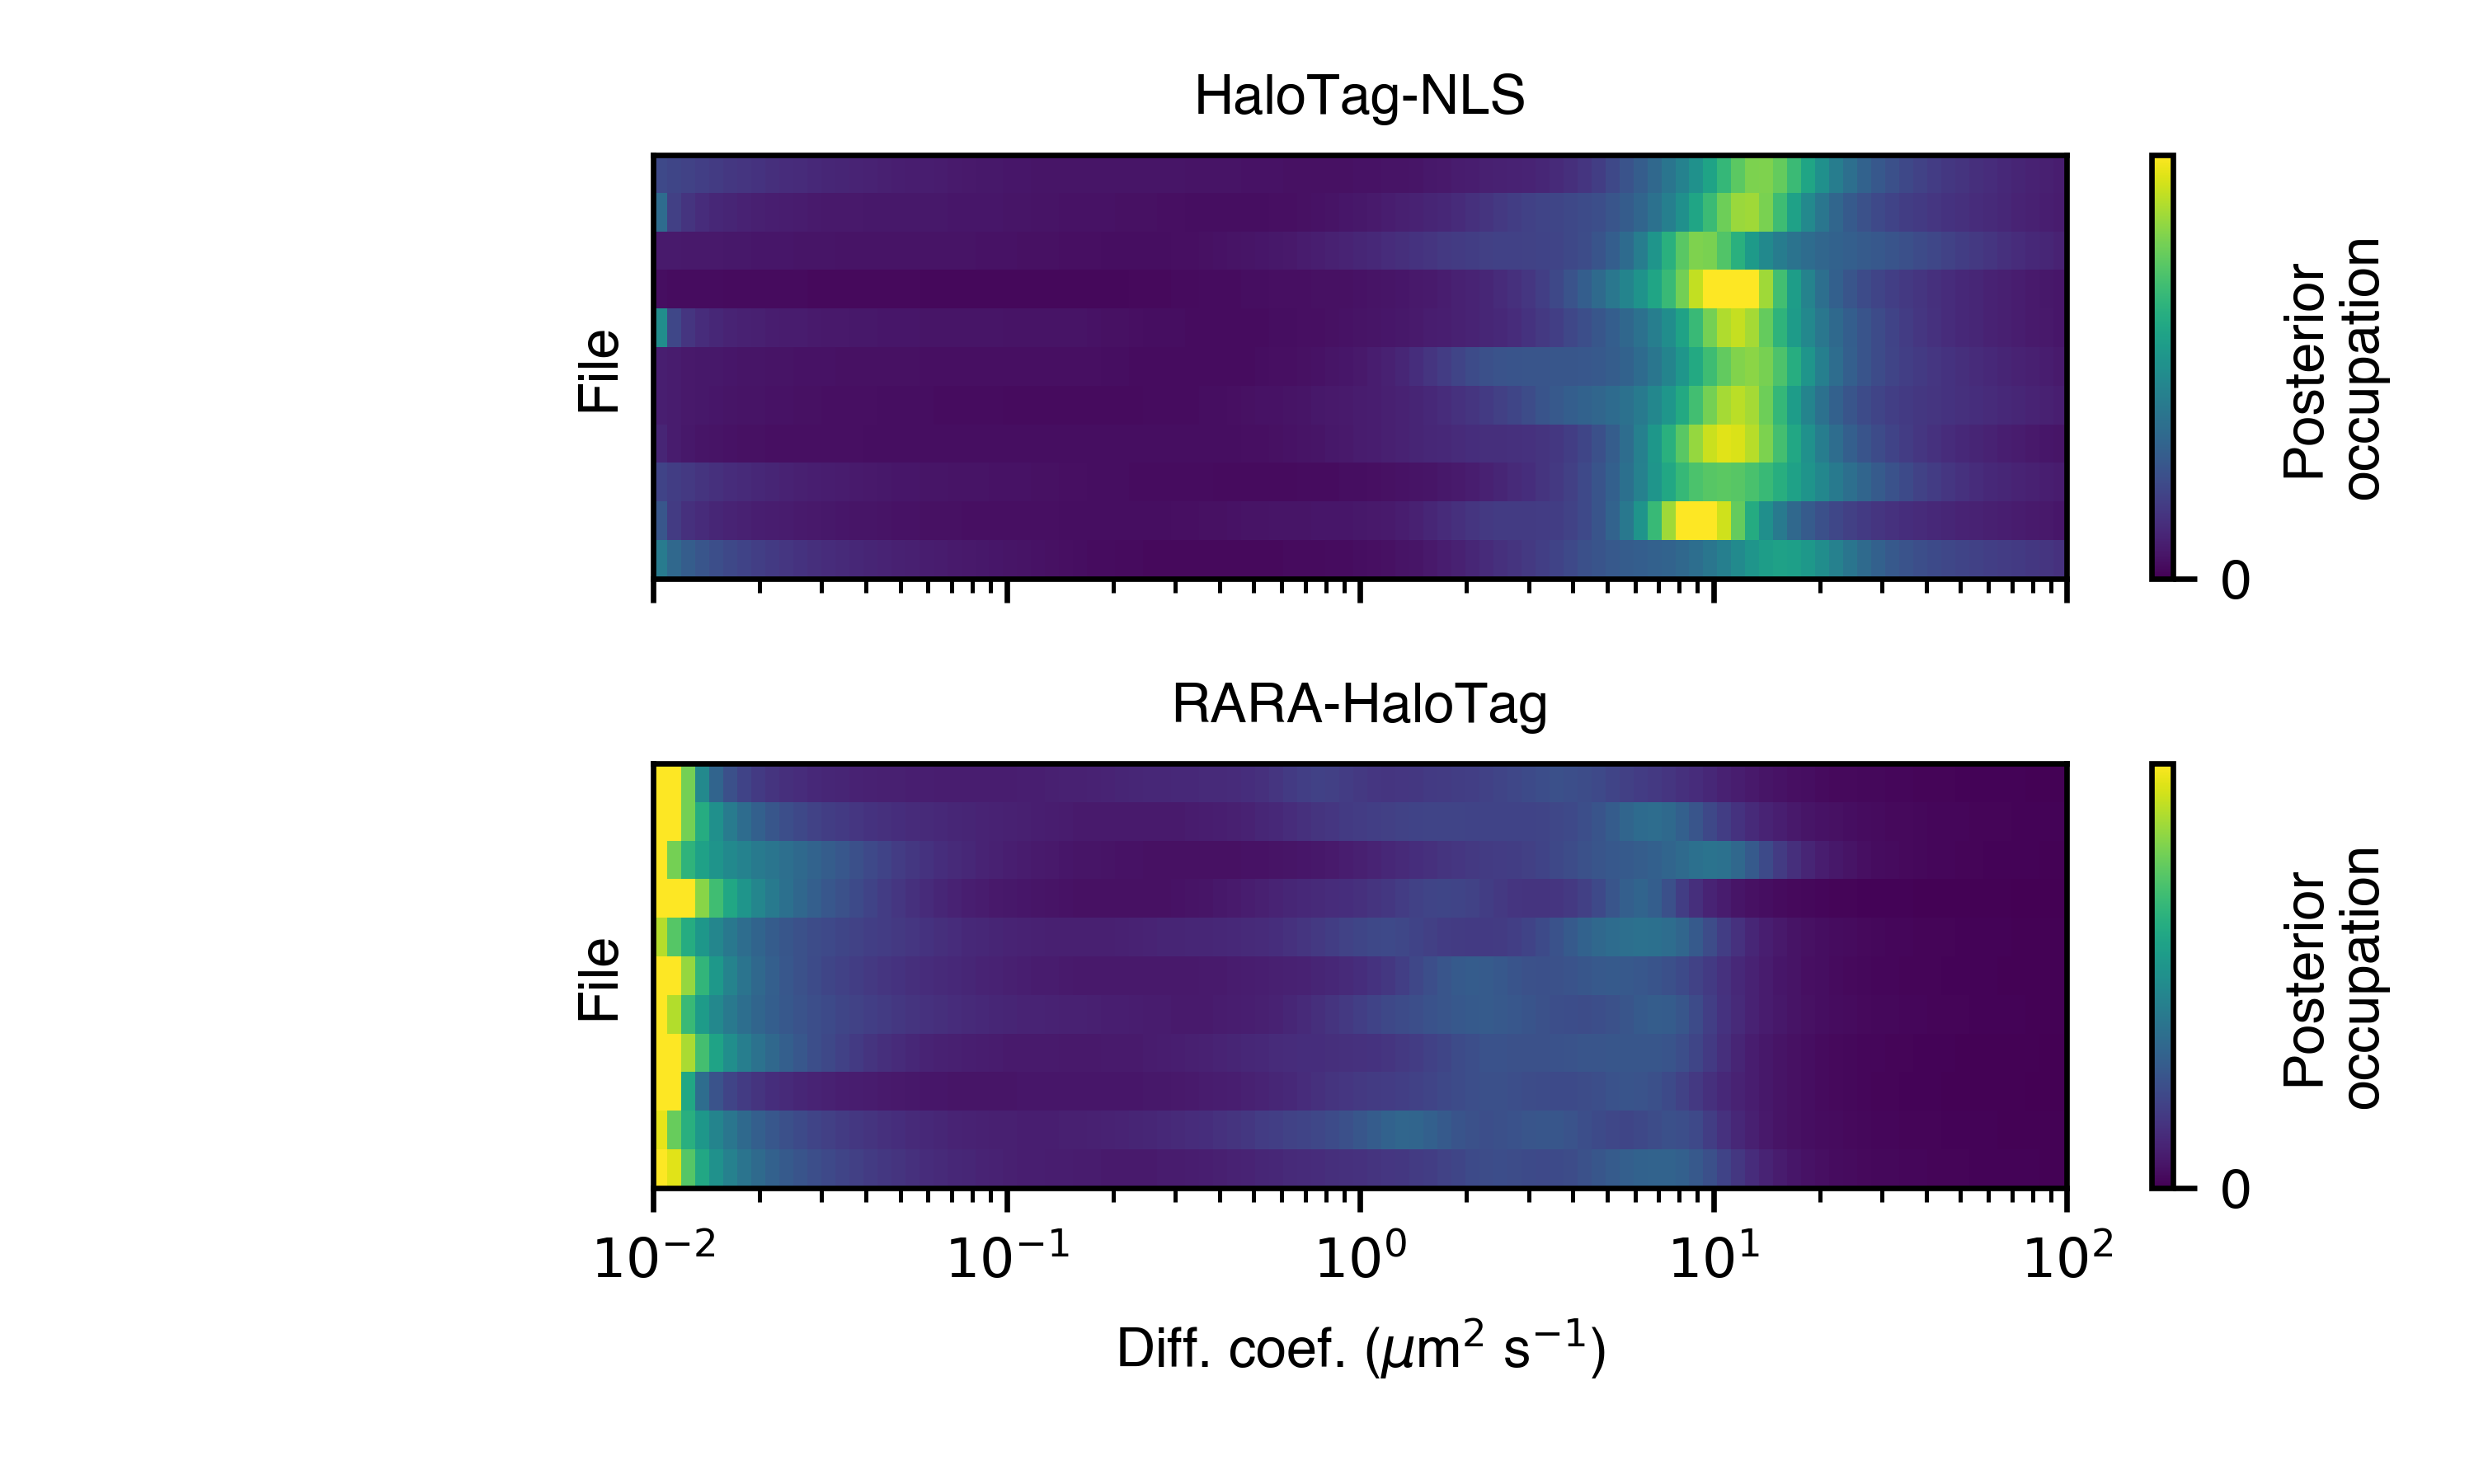
- posterior_heat_map(self, out_png: str, normalize: bool = True, order_by_size: bool = True, **kwargs)
Posterior mean state occupations, marginalized on diffusion coefficient, shown as a heat map. Groups by condition.
- Parameters
out_png (str) – save path for this plot
normalize (bool) – normalize the state occupations for each file in the dataset. If False, the intensity for each file is proportional to the number of jumps observed in that SPT experiment.
order_by_size (bool) – within each condition group, order the files by decreasing number of observed jumps.
kwargs – additional kwargs to the plotting function
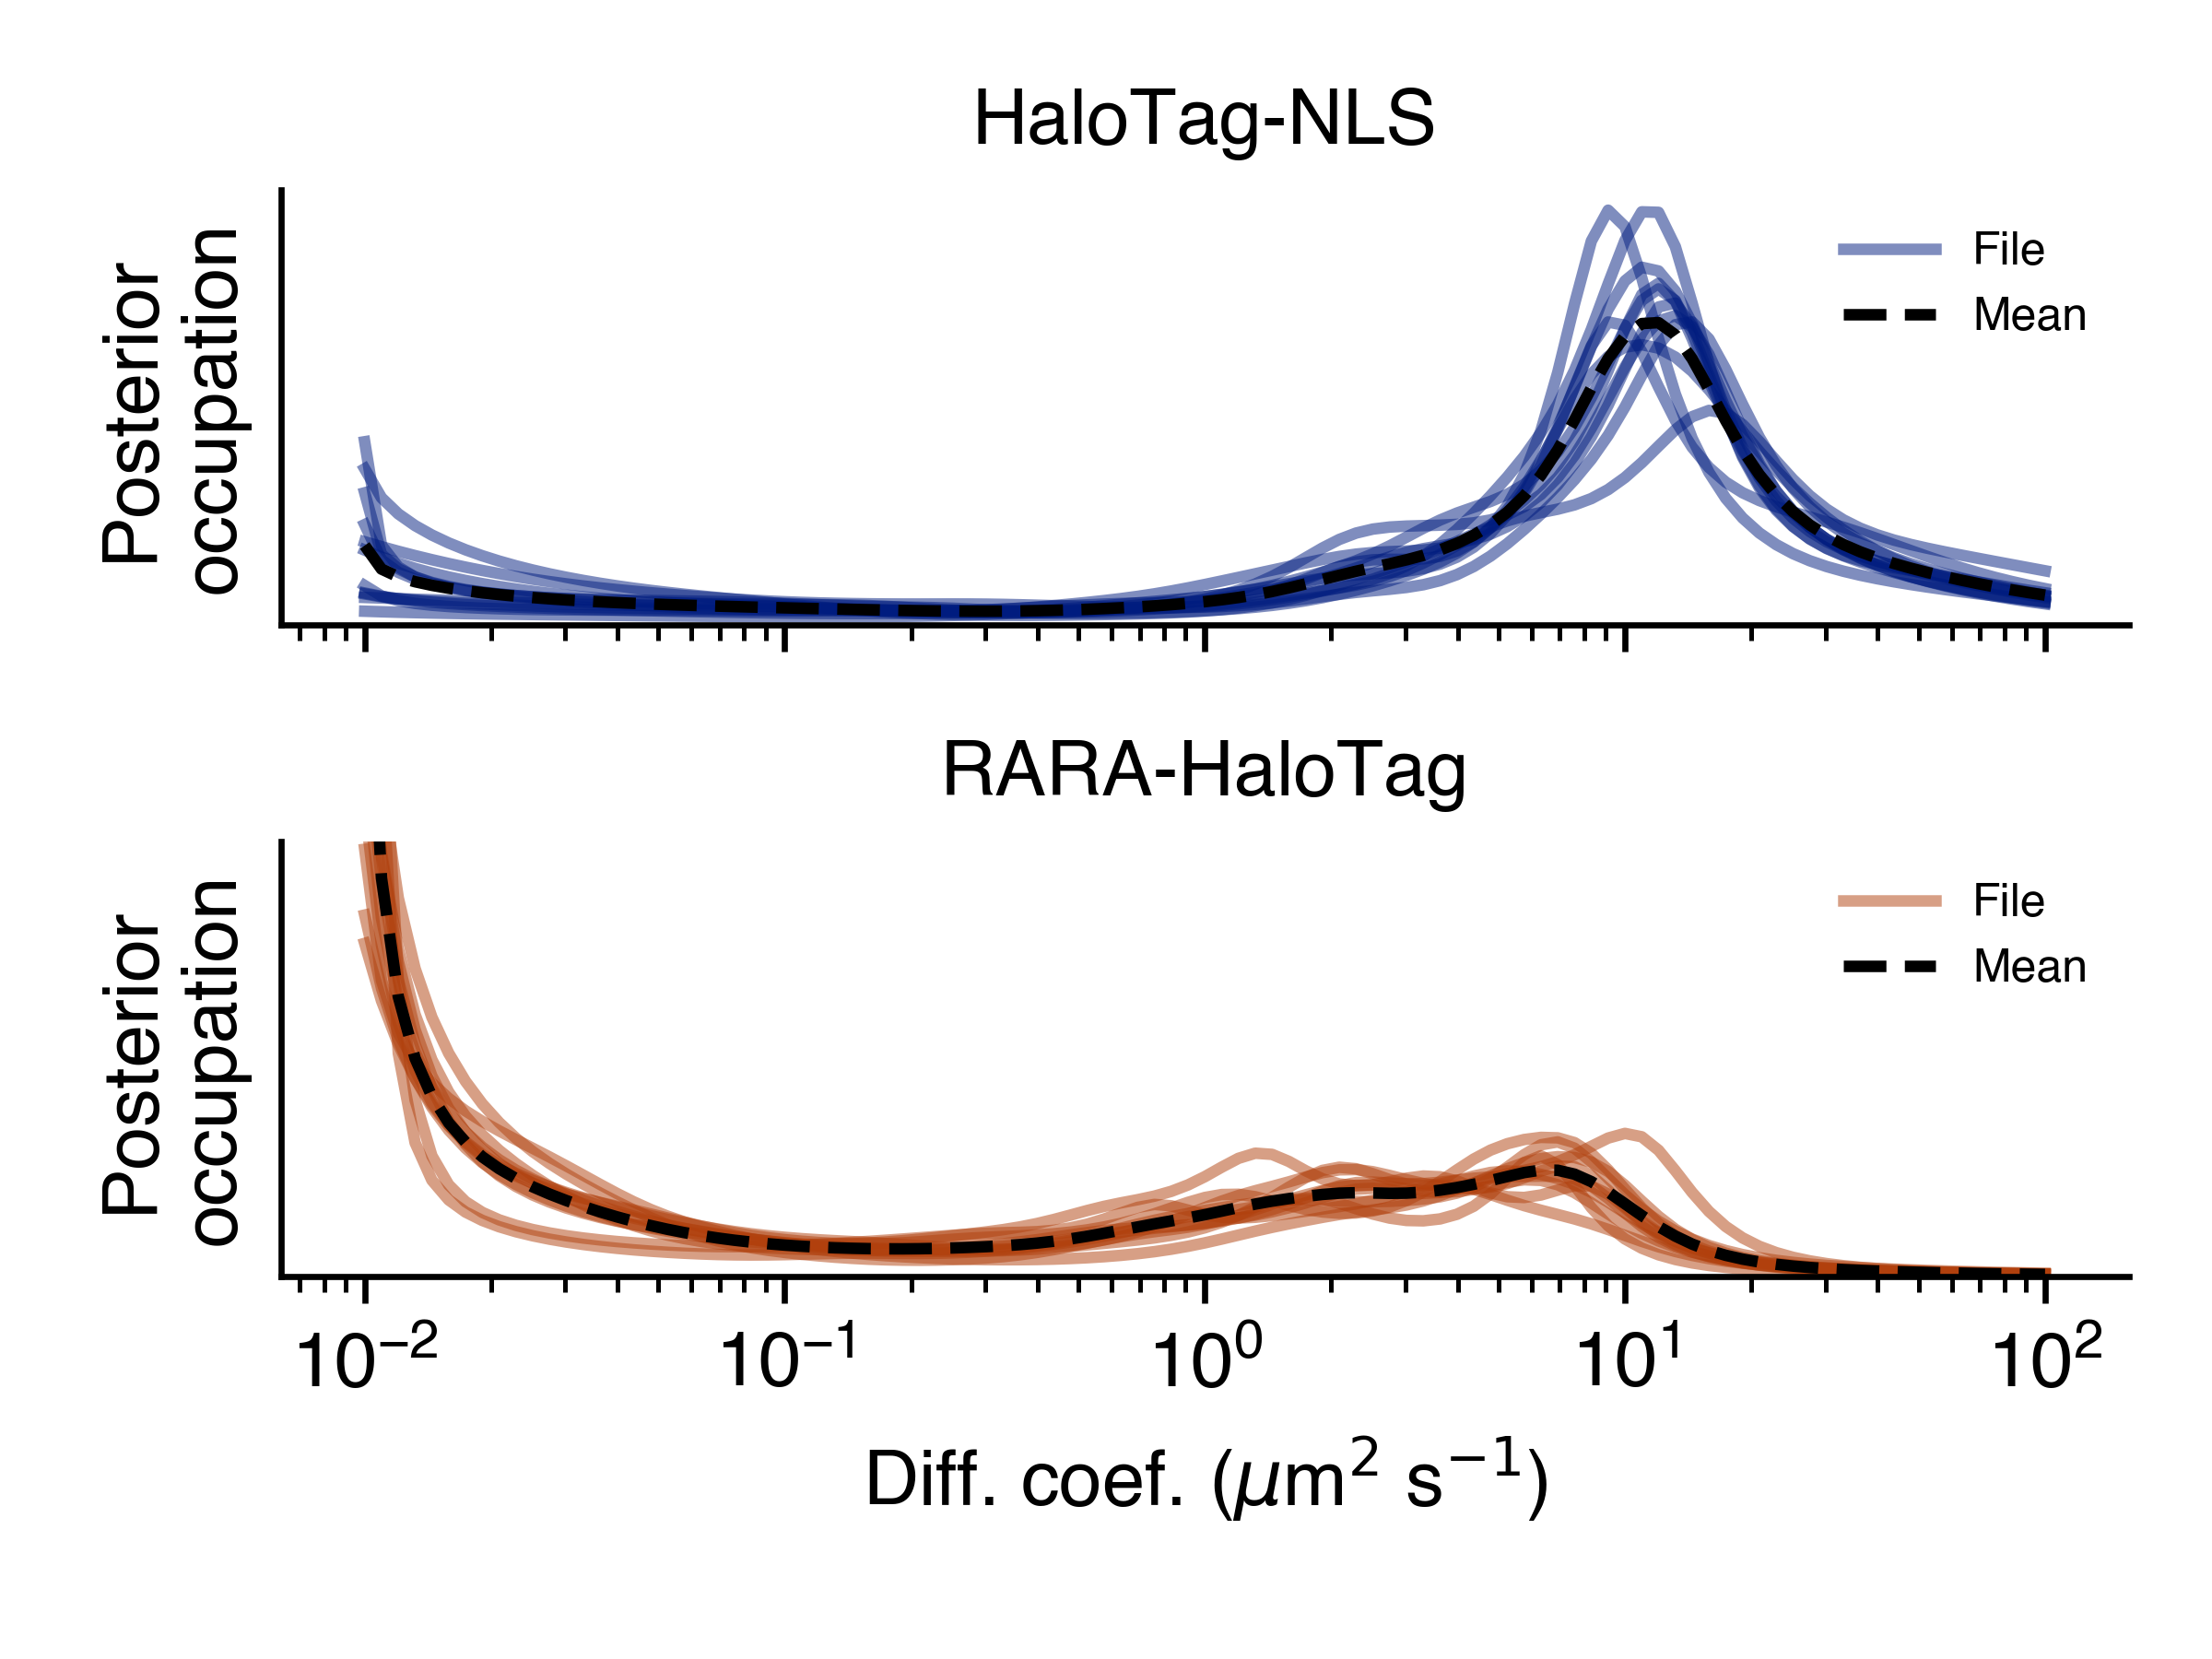
- posterior_line_plot(self, out_png: str, **kwargs)
Posterior mean state occupations, marginalized on diffusion coefficient, shown as a line plot. Groups by condition.
- Parameters
out_png (str) – save path for this plot
kwargs – additional kwargs to the plotting function